In the first two parts of this short series, I’ve looked at some ChemFig basics and improving the settings used to get to publication-quality appearance. In this final part, I want to look as some more complex effects. I’m going to keep using the customisations I made in part two, so the demos here all use them in the preamble.
Decorating bonds
Chemists don’t only use simple line bonds: we use bold, dashed and wavy lines a lot. ChemDraw has all of these set up ‘out of the box’:

ChemFig does not have a simple input syntax for them, unlike = for a double bond or ~ for a triple bond. However, it does let us customise bond appearance: the basic syntax we need is to put [,,,,<settings>] after the bond to be customised (there are four commas here as ChemFig has other settings to alter bonding). The settings are TikZ commands, and it’s possible to set up these customisations as styles, which is better than doing everything by hand.
First, we need two settings from ChemDraw: the thickness to use for a bold bond and the spacing in a hashes. I’ll want to use these a few times, so save them with readable names
\newcommand*{\bondboldwidth}{0.22832 em} %'Bold Width'
\newcommand*{\bondhashlength}{0.25737 em} % 'Hash Spacing'
Bold, hashed and dashed bonds are then easy to set up
\tikzset{
  bold bond/.style = {line width = \bondboldwidth},
  dash bond/.style =
    {dash pattern = on \bondhashlength off \bondhashlength},
  hash bond/.style =
    {
      dash pattern = on \bondwidth off \bondhashlength,
      line width   = \bondboldwidth
    },
}
Wavy bonds are a bit more tricky. TikZ has a ‘decorations’ library including the idea of a ‘snake’ line, but this is not quite right. Instead, I’ll use a ‘real’ sine wavy as described on the TeX-sx site.
At the same time, I want to pick up something ‘internal’ from ChemFig: the inter-atom spacing, which we set using \setatomsep. That’s stored in the macro CF@atom@sep, which I want as wavy bonds should have an integer number of repetitions along a standard-length bond:
\tikzset{
  wavy bond/.style =
    {
      decorate,
      decoration =
        {
          complete sines,
          amplitude   = \bondboldwidth,
          post length = 0 pt,
          pre length  = 0 pt,
          % Use the atom spacing: saved
          segment length =
            \the\dimexpr\csname CF@atom@sep\endcsname/5\relax
        }
    }
}
Okay, so how does this all look? The document input is not so bad
\chemfig{
  *6((-[,,,,hash bond])-
  -(-[,,,,wavy bond])
  -(-[,,,,dash bond])-
  -(-[,,,,bold bond])-)
}
and gives result
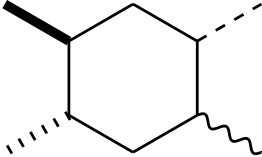
If you look really carefully, you’ll see that this highlights an issue. The bond junctions are just flat ‘ends’, which does not show very much for the single bonds but does where the bold bond meets the ring. If you compare with ChemDraw, you’ll see that it does not make the same error: the bonds ‘run in’ to each other. I’ve not found a way to solve that, unfortunately.
Into three dimensions
Chemical structures exist in three dimensions, and it’s very common to show this using wedged bonds, invented by Cram.

ChemFig let’s us use < in place of - for a filled wedged bond, with <| for a hollow one and <: for a dashed (backward) one. So the input we want here is
\chemfig{
  *6((<)-(<:)-(<|)-(>)-(>:)-(>|)-)
}
If you try that with no setting changes, the bonds are too wide at the ends. That’s controlled by \setcrambond, which has three parameters: the width of the bond, the thickness of hash lines and the hash line spacings. ChemDraw seems to set the wider end to the width of a bold bond plus two normal bonds, so I used
\setcrambond
  {\the\dimexpr \bondwidth * 2 + \bondboldwidth \relax}
  {\bondwidth}{\bondhashlength}
and got
Here, it’s clear that the issue with bond joins shows up a lot more than the earlier cases: it’s still reasonably subtle, but definitely shows up more strongly.
Schemes and so on
I’m focussing here on drawing individual structures, but should mention schemes and compound numbering. In the MyChemistry article I’ve already linked to, there is quite a bit about this, using a combination of ChemFig (for the schemes) and chemnum for the numbering. What I will say is that it works well provided you don’t have complex alignment needs: one of the tricky parts of creating a good-looking scheme is deciding exactly what to line up!
The other quick note I’d add on schemes is that the arrow width really should match that of bonds. So I’d use
\setarrowdefault{,,line width = \bondwidth}
in my preamble to have everything match.
Conclusions
With a bit of effort with the settings, ChemFig can produce quality output, and can get quite a bit ‘right’ (although there are a few gaps). However, as I said in the first part, I won’t be abandoning ChemDraw any time soon. I deliberately picked something reasonably straight-forward for my tests, and the sort of thing I do in my research work would be a lot harder to draw and maintain using ChemFig. In particular, I don’t fancy trying to show up three-dimensional affects (for example a benzene ring going ‘into’ the page) using a text-based approach.
So what could I recommend ChemFig for? First, the most obvious case is for people who don’t have a copy of ChemDraw. There are other graphical editors, but none of the free ones are as good as ChemDraw. So if you want high-quality output without paying, this looks the best approach I’ve seen. It also looks good for creating stand-alone documents (using ChemDraw means needing graphics files). That does look useful for me for teaching, where the structures will be in general not so complicated and where it will be perhaps better to have only a single .tex file. There’s also the fact that drawing using TikZ means that the font match using ChemFig is exact: no need to try to measure up different fonts by eye. So there are uses for ChemFig, and it’s certainly an interesting package. Now all we need is someone to write a ChemDraw to ChemFig converter!